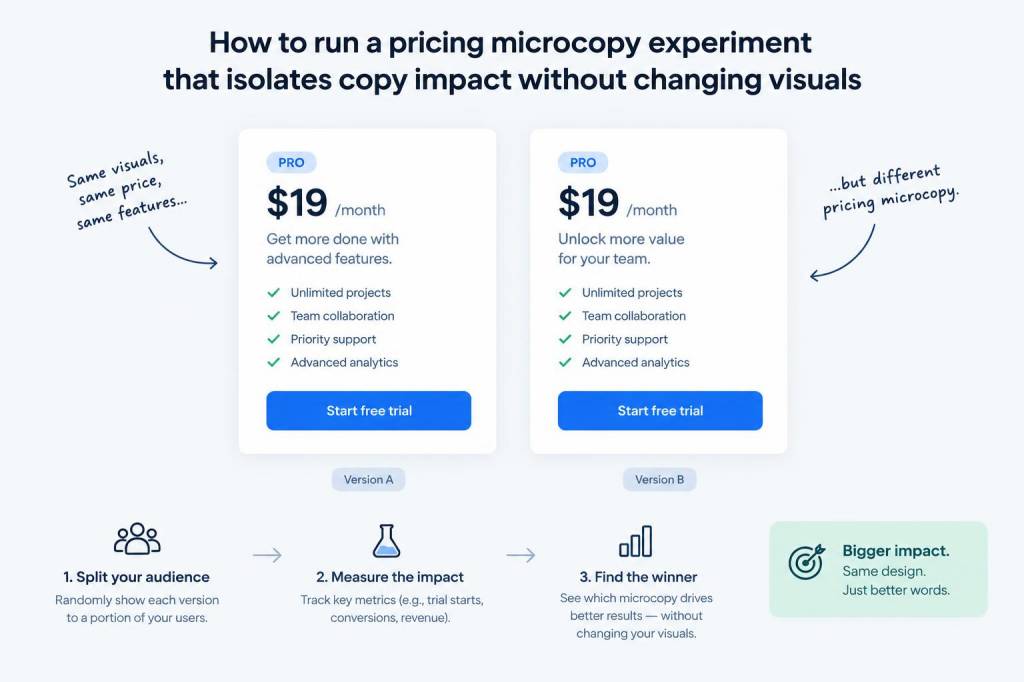
I recently ran a pricing microcopy experiment that became one of those small projects with disproportionately useful learnings. The goal felt simple: measure how changing just the wording around price—without touching the layout, colors, or anything visual—affects user behavior. It’s an attractive idea because copy is fast to iterate on and cheap to test, but isolating its effect is surprisingly tricky. If you want clear signals from a copy-only test, here’s the workflow I used, the pitfalls I avoided, and the practical tips that made the data meaningful.
Why isolate copy from visuals?
Visual changes—like a new CTA color or a redesigned pricing card—can have a big impact on conversions. If you change those at the same time as copy, you don’t know what did the heavy lifting. I wanted to understand the pure psychological lift (or drop) that microcopy can deliver: things like “Billed monthly” vs “Pay monthly” or “Save 20% when billed annually” vs “You’ll save 20% with an annual plan.” Those small shifts can change clarity, perceived value, and friction, but only a copy-isolated test reveals their true effect.
Define the hypothesis and success metrics
Start with a crisp hypothesis. For my test the hypothesis was: Clarifying the duration and savings in the pricing microcopy will increase plan selections by reducing confusion. A clear hypothesis keeps the variations focused and prevents scope creep.
Choose one primary metric and a couple of secondary metrics. For pricing microcopy experiments I recommend:
Keep the funnel consistent: if you track clicks on the CTA, make sure the next steps remain identical for all variants.
Keep visuals truly constant
This is the hard part in practice. Designers and PMs often want to “improve” the card while testing copy—don’t fall for it. I locked the CSS and layout before launching the experiment and served copy changes via the translation/localization layer or a simple DOM text replacement script that only touched text nodes. That ensured that spacing, font sizes, and CTA prominence did not change.
Things to freeze:
Designing your copy variations
Because changes are tiny, be intentional. I grouped variations into categories:
Limit to 3–4 variations plus a control. With microcopy, too many arms dilutes power. For my test I used: control, clarity-first, value-first, and combined clarity+value.
Implementing the experiment
I used a server-side experiment tool so the HTML delivered to users already contained the copy variation—avoiding flicker or client-side swapping that could influence perception. If you’re using a client-side A/B test tool, ensure the content swap happens before paint.
Randomize users at the session level and persist the variant across that session to avoid cross-contamination. Also, target the right traffic: testing on new visitors vs logged-in users can produce different results. I focused on trial signups from product pages, which is where pricing decisions are most relevant.
Sample experiment matrix
| Variant | Microcopy example | Why it matters |
|---|---|---|
| Control | “Pro — $20 / mo” | Baseline |
| Clarity | “Pro — $20 / mo (billed monthly)” | Reduces ambiguity about billing period |
| Value | “Pro — $20 / mo (save 20% annually)” | Highlights savings to increase perceived value |
| Combined | “Pro — $20 / mo (billed monthly). Annual: save 20%” | Mixes clarity and savings |
Statistical power and sample size
People underestimate how many visitors you need to detect small changes. Copy-only experiments often have subtle effects (2–5% lift). I ran a power calculation beforehand to know when to stop. If you don’t have a stats tool handy, aim for at least several thousand visitors per variant for reliable detection—exact numbers depend on baseline conversion and expected lift.
Don’t stop early because a variant looks promising; wait until you reach your pre-defined sample size or confidence threshold. Early peeking inflates false positives.
Qualitative signals matter
Microcopy can affect micro-decisions that analytics miss. I paired the quantitative test with qualitative tactics:
These cues helped explain why a variant moved numbers (e.g., clarity reduced support requests about billing frequency).
Common pitfalls and how I avoided them
Interpreting the results
When the experiment wrapped up, the clarity variant had a modest lift in plan selection (+6% relative) and reduced FAQ clicks about billing by 18%. The value-first variant increased clicks marginally but didn’t lift downstream conversions—people were curious but not convinced to commit. Combining clarity and value produced the best outcome: a 9% increase in selections and a 12% reduction in initial support contacts.
What mattered wasn’t a single “winning” phrasing; it was understanding the behavioral mechanism. Clarity removed friction. Value statements increased interest but needed trust signals or better framing to convert.
How to operationalize learnings
Once you’ve identified effective phrases, roll them into your canonical copy library and document where they work best (trial signups vs checkout vs marketing pages). Run follow-up tests to refine placement—for example, should “save 20%” be in the pricing card or only visible in the billing modal?
Finally, embed the experiment artifacts in your design system: make microcopy part of the components so engineers and content designers reuse proven language consistently.