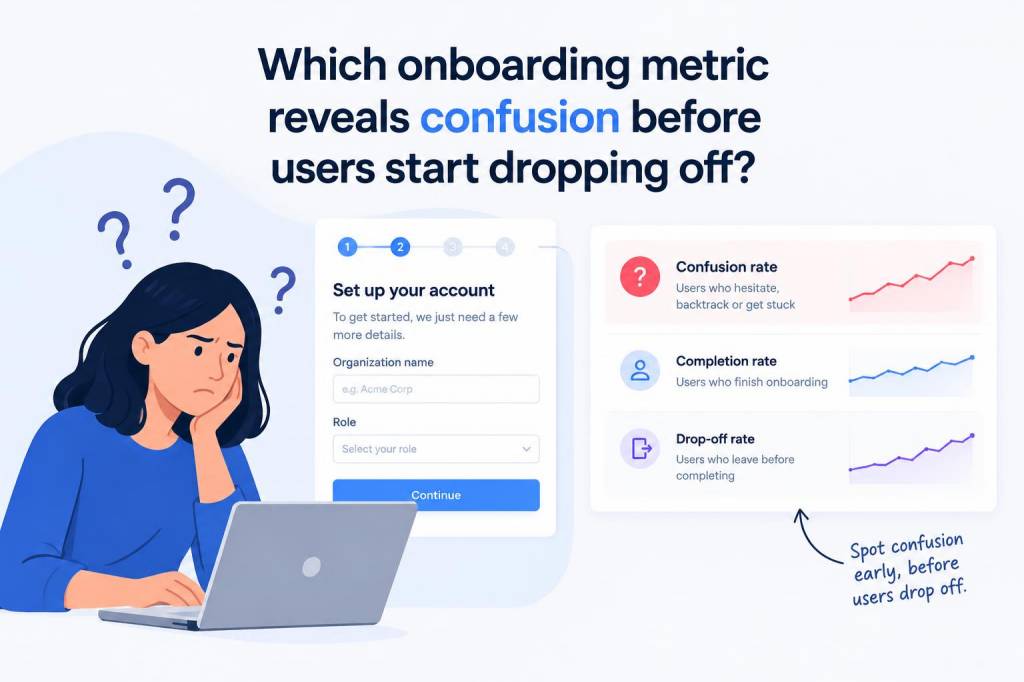
When I look at onboarding data, I rarely trust drop-off rate on its own. By the time users abandon a flow, confusion has often been building for several steps already. If I want an early warning signal, I focus on time to first meaningful action paired with friction signals such as repeated clicks, field errors, backtracking, and help usage. In practice, that combination tells me users are stuck before they quit.
The metric I trust most
If I had to choose one metric that reveals confusion before users start dropping off, I would choose time to first meaningful action. I care less about raw time spent in a screen and more about how long it takes a new user to reach the first action that proves they understand value. That could be creating a first project, importing data, inviting a teammate, completing a profile step, or reaching a first successful outcome in your product.
Why do I like this metric so much? Because confused users do not always leave immediately. Many of them hesitate, reread copy, hover over controls, switch tabs, go backward, or make a few wrong turns before they give up. A long delay before a meaningful action often means the interface is asking too much too soon, or the value promise is still too abstract.
I have found that onboarding teams often celebrate completion rate while missing the uncomfortable middle. A flow can still finish “successfully” even when users are uncertain, because some people are persistent, polite, or simply not ready to quit. Time to first meaningful action gives me a clearer picture of whether users are moving with confidence or stumbling through the experience.
What confusion looks like in real behavior
Confusion rarely appears as a single dramatic event. It shows up as a pattern. When I inspect onboarding sessions, I usually look for the following signals:
- Long pauses before the first click or next step
- Repeated clicks on the same element without progress
- Form errors that appear in the same place for many users
- Backtracking to earlier screens or previous steps
- Help center visits during a flow that should feel self-explanatory
- Aborted inputs, such as partially filled forms that never get submitted
- Unexpected exits after a confusing prompt or permission request
These signals matter because they often arrive before abandonment. A user does not need to disappear for me to know something is off. If three out of ten new users pause at the same step for twenty seconds, then click around without taking action, I already have a strong clue that the design is creating uncertainty.
Why drop-off alone is too late
Drop-off rate is a lagging indicator. It tells me where users eventually leave, but not why they were struggling before that moment. By the time the curve drops, the damage is already done. I want earlier evidence so I can improve the experience while users are still inside the flow.
That is why I treat onboarding as a sequence of micro-decisions. Every step either reduces uncertainty or adds it. A user might stay because they are determined, not because the flow is clear. If I only watch exits, I may miss the hidden friction that hurts activation, confidence, and long-term retention.
In my work, I have seen onboarding problems that never caused dramatic abandonment, yet still weakened product adoption. Users reached the end of the flow, but they did so slowly, with hesitation, and without fully understanding what they had done. Later, they were less likely to come back. That is a quiet failure, and drop-off data alone does not always expose it.
How I measure confusion without guessing
I like to combine quantitative and qualitative data. Numbers tell me where friction exists; observation tells me why.
| Signal | What it suggests | What I check next |
|---|---|---|
| Time to first meaningful action | Users are uncertain, distracted, or overwhelmed | Step clarity, copy, information order, visual hierarchy |
| Repeated clicks | Users expect a control to do something else | Labeling, affordance, interaction feedback |
| Form error rate | Instructions are unclear or validation is too strict | Field design, placeholder copy, error messaging |
| Backtracking rate | Users lost context or missed a requirement | Step order, progress visibility, dependency clarity |
| Help usage during onboarding | Users need interpretation support | Tooltips, inline guidance, FAQ placement |
I especially like session replays and event funnels for this work. Session replays let me see hesitation in context, while event funnels show where a step takes longer than expected. Heatmaps can help too, but I do not rely on them alone. A click map may show activity without revealing whether that activity was confident exploration or desperate searching.
When I measure time to first meaningful action, I always define “meaningful” relative to product value. For a project management app, it might be creating a first board. For a design tool, it might be starting a canvas and placing the first asset. For a finance app, it might be linking an account. The point is not speed for its own sake; the point is whether the user reaches value with enough clarity to feel momentum.
What I look for in the first few minutes
The earliest minutes of onboarding are often the most revealing. I watch for a few specific patterns:
- Fast action with confidence: a good sign that the path is obvious
- Slow action with no errors: possibly curiosity, but also possible uncertainty
- Slow action with errors: a clear friction point
- Fast skips through content: users may be trying to escape the onboarding, not learn from it
- Delays after permission prompts: often a sign that trust has not been established
I pay close attention to hesitation after a value statement. If a product says, “Start your first campaign in seconds,” but users spend a minute searching for the right next step, I know the promise and the experience are out of sync. That gap is one of the strongest clues that confusion exists before drop-off appears.
My favorite early-warning metric stack
If I were setting up onboarding analytics from scratch, I would use a small stack of metrics rather than one number alone. My preferred stack looks like this:
- Time to first meaningful action
- Step-level completion time
- Error rate per field or screen
- Backtrack frequency
- Help interaction rate
- Activation completion rate
This mix helps me separate confusion from delay. For example, a long completion time with very low errors may indicate that users are reading carefully. A long completion time with repeated backtracking and help clicks is much more likely to indicate friction. That distinction matters, because not every slow user is confused, and not every quick user is comfortable.
I also like to segment these metrics by source. Users who arrive from a product tutorial, a referral, or a paid ad may have different expectations. One group may already understand the value proposition, while another may need more context. If I compare everyone as a single population, I can miss important patterns. Some onboarding problems are not universal; they are audience-specific.
What usually causes a slow first action
When the metric is weak, I usually find one of a few root causes:
- Too much information too soon
- Unclear value before the first step
- Labels that sound internal instead of user-centered
- A required choice that feels premature
- Visual hierarchy that hides the next action
- Trust concerns around permissions or data requests
- Onboarding copy that explains features instead of outcomes
I have learned that users do not need a perfect product to start successfully. They need a product that makes the next move feel obvious, safe, and worthwhile. When that is missing, confusion shows up long before abandonment.
How I act on the signal
Once I identify confusion, I do not rush to add more instructions. More copy often makes the problem worse. Instead, I ask a few sharper questions: Is the first step necessary? Can I remove a decision? Can I move proof of value earlier? Can I replace explanation with a direct action? Can I make progress more visible?
In many cases, the fix is not more onboarding but better sequencing. I try to front-load clarity, reduce cognitive load, and get users to a small success as early as possible. That first success changes everything. It lowers anxiety, builds trust, and makes later steps feel easier.
I also like to test whether the interface itself is doing enough work. A well-placed default, a smarter empty state, a clearer button label, or a more precise permission explanation can reduce confusion without adding a single extra step. Those are often the improvements that move the metric most.
So when I ask which onboarding metric reveals confusion before users start dropping off, I do not point to abandonment itself. I point to time to first meaningful action, and I read it alongside friction signals. That is usually where the truth lives: not at the moment users leave, but in the quiet hesitation that comes before they do.